
.
ecgAUTO is an in-depth cardiovascular analysis software. From multiple species or leads, it uses shape recognition techniques for interval analysis, arrhythmia detection, heart rate variability, blood pressure assessment, etc. Features include customizable parameters and protocols, interactive dashboards, batch analysis, comprehensive data reports, and more.
Optional GLP modules and SEND formatted exports are also available.
Add-on modules for neurological and respiratory analysis create a single analysis platform for interdisciplinary studies.
ecgAUTO modular design allows you to implement only the needed analysis tools.
Simple modules like RR analysis, blood pressure or blood flow assessment can be used in stand-alone, or combined with additional modules, for advanced analysis:
Add-on modules for neurological and respiratory endpoints can be combined for multi-disciplinary studies.
Additional modules for importation of non-EMKA files as well as GLP modules, SEND formatted exports, and vEEG* are also available.
*Video-electroencephalogram
In-depth ECG analysis is at the heart of ecgAUTO software.
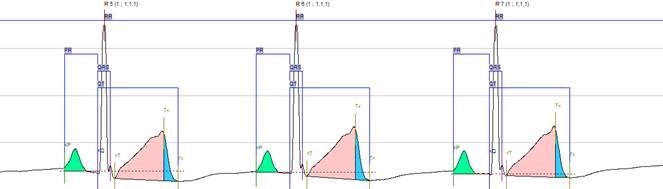
Using the pioneering shape recognition techniques, ecgAUTO is able to analyze normal or abnormal ECG morphology, from any species and any lead.
The shape recognition technique requires a library of reference waveforms, built and edited by the user. Specific libraries can be built for different species or leads, which make the strength of this technique.
Several days of manual analysis are turned into a few minutes of automated analysis with ecgAUTO software:
Did you know?
ecgAUTO can perform a concurrent interval and arrhythmia analysis, eliminating the need for multiple analyses of a single data file.
Load, analyze, and export large data files in minutes.
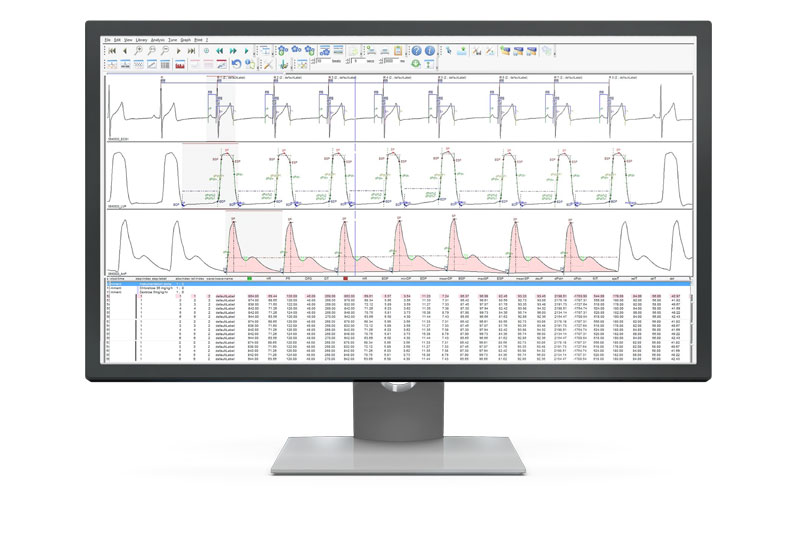
Interval and Arryhthmia Analysis: Standard or custom parameters and protocols are used in analysis and for the production of comprehensive data reports. Interactive dashboards (i.e. multi trend graph, XY plot, Poincaré plot) can be utilized to QA/QC your data on the fly.
Perform batch analysis with custom configurations on a per file and per subject basis.
Manually mark and qualify events, such as arrhythmia for example, according to a predefined list of labels.
ecgAUTO software is designed to help you meet Good Laboratory Practice (GLP) standards, ensuring data integrity, reliability, and consistency for regulatory compliance. Optional GLP modules can be activated to strengthen your study management and data handling processes.These modules provide robust tools for secure user access, audit trails and electronic signatures, offering peace of mind and confidence in your data’s integrity.
User management: This module controls access to the software, ensuring that only authorized individuals can view or modify data. Users are granted specific access rights based on their role (e.g., administrator, standard user) with:
Audit trail: This module automatically logs all actions that may affect raw or processed data. It collects these audit lines and stores them in a secure database for future reference.
Each entry includes a list of actions done on emka TECHNOLOGIES programs, such as the date and time of the action, the user who performed the action or the computer where he action was executed.
These audit records are invaluable for tracking changes and ensuring data integrity during your research.
Electronic signature: The eSIGN module provides secure, encrypted electronic signatures, ensuring compliance with industry regulations and safeguarding the authenticity of your data.
Study management: This module allows you to efficiently associate data files with specific studies, helping you stay organized and ensuring proper documentation of all experimental data.
To comply with SEND requirements, ecgAUTO generates SEND 3.1 compatible tables that can easily be exported to .xls, .csv and integrated into third-party solutions by Instem and Xybion to increase productivity in preclinical studies.
The events edit option allows to manually mark and qualify events, such as arrhythmia for example, according to the SEND terminology.
In an interview, Alex Carll, from the University of Louisville, explains how he uses ecgAUTO software to analyze ECG, blood pressure, and left ventricular pressure in rodents.
Alex Carll studies the biological mechanisms by which air pollutants weaken the heart, impair cardiac conduction, and compromise hemodynamics, and whether such effects occur through the autonomic nervous system.
“The autonomy to adjust fiduciary points of the library waveforms for pattern recognition in ECG analysis sets ecgAUTO apart from competing software. The software can handle large datasets with multiple physiological signals per file as well.“
Dr. Alex Carll, University of Louiseville.
No. ecgAUTO is suited to all user levels. It can be used in different ways by different types of users.
emka TECHNOLOGIES provides training and user documentation to allow new users to get up and running very rapidly and to show experienced users advanced functions and different ways of using ecgAUTO.
Furthermore, when used in combination with user management software, different access levels can be provided for different users. So, “experts” have access to all functionalities and settings, “users” or “mini-users” have fewer possibilities and a very simple system. “Mini-users” can only load a file, view it, analyze data, view results, and save. They cannot see or modify settings, nor edit beats. They are not slowed down by the full range of options and they are not able to mishandle the system.
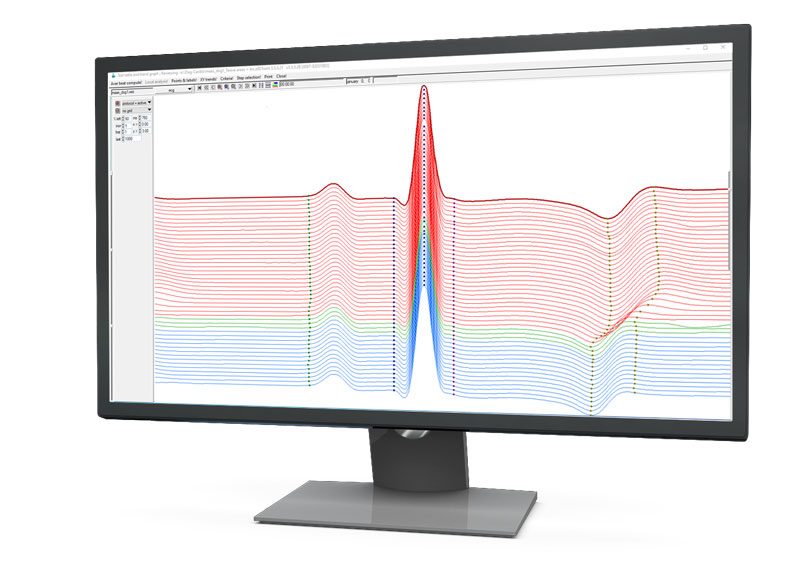
ecgAUTO uses pioneering shape recognition techniques for ECG analysis.
A library is a group of waveforms used as reference waveforms. During analysis, each candidate waveform in the signal is compared to library waveforms. If a sufficiently similar library waveform exists, the candidate waveform “passes” and marks (start of P wave, peak of R wave etc) can be plotted. Otherwise, the candidate waveform is rejected.
Usually, a library contains 10 to 30 waveforms. It is common practice to use one library per species. However, in some cases, there are good reasons to create one library per subject.
emka TECHNOLOGIES can supply pre-built libraries for beginners.
If we consider, for instance, users who use the software for analyzing rat ECG data and dog ECG data, we recommend they build a library for each animal species. Having all waveforms, from both animal species, in the same library is feasible and would produce correct analysis but would unnecessarily slow down the analysis.
Some users go as far as building a specific library for each subject. We feel that this is justified when a relatively small number of animals will be studied for many months or even for a few years. However, we recommend using one library per species.
Let us assume, for example, that we have a set of ECG recordings from 40 beagle dogs. Each one is a file produced in, or converted to, the IOX format.
It would take up to 2 or 3 hours for a member of the emka TECHNOLOGIES team to build the library capable of analyzing this set of files. The library would typically contain about 20 to 40 waveforms.
Now suppose that a new study on different beagle dogs needs to be processed. The number of extra waveforms to be added will be limited by 5 to 15, and would require an extra hour or so.
Once the library is set to analyze around 100 subjects, only very occasional additions to the library will be required.
For example:
Some analyzers may require several inputs in order to generate all the relevant parameters (e.g. for the Blood Flow analyzer, a pressure input is required along with a flow input to compute resistance).
Save time evaluating emka TECHNOLOGIES equipment by having an Application Specialist conduct a custom literature research.
Researchers will receive an email report showing emka TECHNOLOGIES publications relevant to their specific application research area, along with custom equipment recommendations and commentary.
